
Generative Evaluation of Audio Representations#
We compute the manifold embedding of the generated dataset’s nearest neighbor graph under a number acoustic representations of the dataset:
Mel-frequency Cepstral Coefficients
Time Scattering
Time-Frequency Scattering
Open-L3 deep feature embeddings (music encoder)
We first transform the audio dataset \(x\) under each acoustic feature representation \(S\), then run the Isomap algorithm over the AM/FM 4096 signals in \(Sx\).
To visualize similarity relationships between the AM/FM signals, we apply the Isomap algorithm for unsupervised dimensionality reduction \cite{tenenbaum2000global}.
Isomap assembles a geodesic distance matrix by using neighborhood relationships from high-dimensional Euclidean distances. We first compute the MFCCs, Scattering1D and JTFS coefficients, and OpenL3 embeddings over the dataset of AM/FM signals generated by \(g\)
To compute the nearest neighbor graph, we consider the 40 nearest neighbors for each transformed data point.
We select three components for the manifold visualization. The audio dataset described in Section \ref{sec:dataset} characterizes three independent degrees of freedom, therefore we postulate that Isomap will reveal whether the coordinates of an audio representation reflect similarities within the AM/FM signals.
Generative Evaluation of MFCCs#
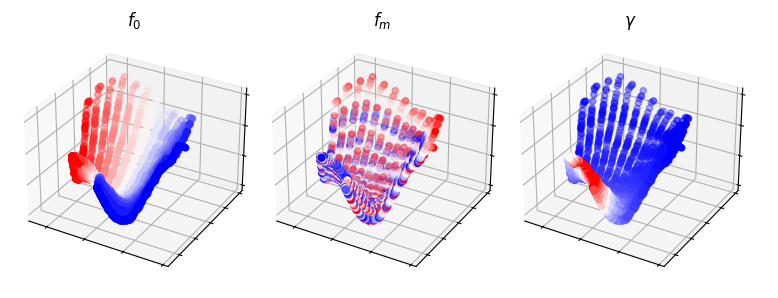
We observe that in the case of MFCCs, the Isomap embedding forms a curved 2-D manifold, whereas our dataset contains three factors of variability. Only the fundamental frequency \(f_c\) clearly aligns with one of the Cartesian coordinates. Meanwhile, similarities between amplitude modulation rates \(f_{m}\) and chirp rates \(\gamma\) are not represented faithfully. Therefore, neighboring points on the graph may have very dissimilar values of \(f_m\) and \(\gamma\).
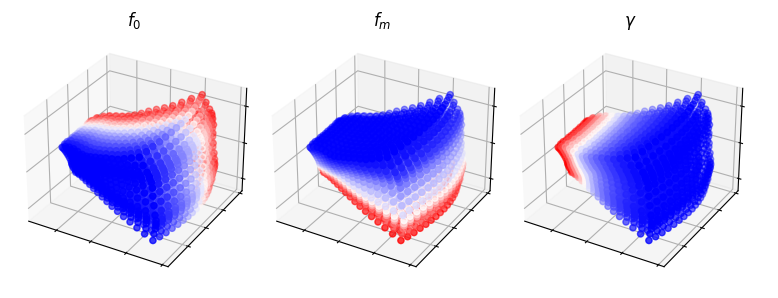
Generative Evaluation of Scattering1D#
We also compute time scattering (Scattering1D) coefficients, setting \(Q = 1\) and \(J = 14\) with global temporal averaging.
Time scattering does not capture spectrotemporal patterns beyond a log-frequency interval \(1/Q_f\), where \(Q_f\) is the quality factor (ratio of center frequency to bandwidth).
Hence, by setting \(Q = 1\), which results in \(Q_f = 2.5\), we guarantee that the scalogram contains at least one amplitude modulation cycle, given a modulation frequency of at least 4 Hz and a chirp rate of at most 4 octaves per second.
Although Scattering1D recovers the 3D manifold whose principal components independently align with the 3 synthesis parameter dimensions, this is at the expense of higher \(Q\).
If we seek finer frequency localization, similarity between the spectrotemporal modulations will not be recovered due to the presence of nonstationary frequency.
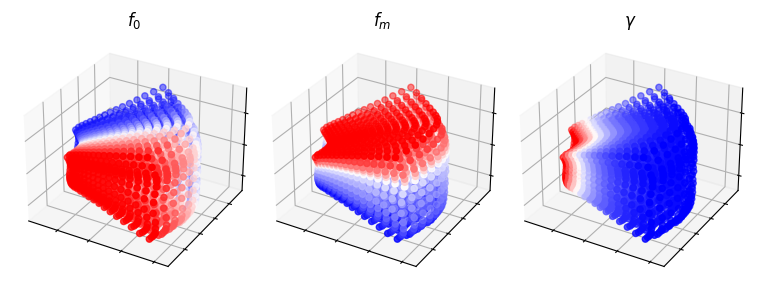
Generative Evaluation of TimeFrequencyScattering#
We compute the time-frequency scattering coefficients of the dataset, setting the hyperparameters as follows:
Number of octaves of the temporal filterbank
J = 13. This is set high to recover slower modulations.Q = (8, 1)filters per octave in the first and second-order filterbanks, respectively.Number of octaves of the frequency filterbank
J_fr = 5.Q_fr = 2filters per octave in the frequency filterbank.filters per octave in the frequency filterbankT = duration * srfor global temporal averaging.F = 0disabled frequency averaging so that the representation is equivariant to pitch transposition and therefore sensitive to variations in pitch.
In the case of both transformations and the application of Isomap manifold learning, the dataset of AM/FM signals is represented as a 3-D mesh where the principal components align independently with \(f_c\), \(f_m\) and \(\gamma\).
Both transformations with their respective hyperparameters are capable of disentangling and linearizing fundamental frequency, tremolo rate and chirp rate, which describe spectrotemporal modulation patterns.
Generative Evaluation of OpenL3#
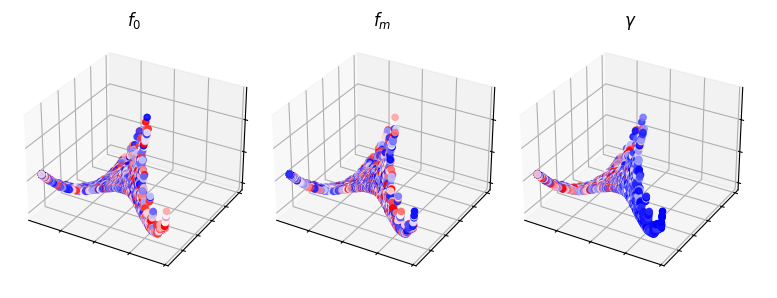
Fig. \ref{fig:isomaps}(c) visualizes the embedding for time scattering when \(Q = 8\).
In this case, we observe that the dataset lies on a 2-D manifold that fail to describe similarity between the synthesis parameters.